Exploring global theme park trends through attendance, reviews, and location data.
| Ranking | Amusement/Theme Park | City/State | Country | Region | Final Score | Annual Attendance 2023 | Global Annual Search | Instagram Tags | Google Business Reviews |
|---|---|---|---|---|---|---|---|---|---|
| 1 | Magic Kingdom | FL | USA | North America | 79.46 | 17.72M | 1.6M | 8.2M | 227.1K |
| 2 | Disneyland Paris | Vallée | France | EMEA | 62.27 | 10.40M | 726.0K | 7.0M | 293.9K |
| 3 | Tokyo Disneyland | Chiba | Japan | Asia-Pacific | 61.98 | 15.10M | 486.0K | 8.0M | 106.9K |
| 4 | Epcot | FL | USA | North America | 55.36 | 11.98M | 2.4M | 5.1M | 145.3K |
| 5 | Universal Studios Hollywood | CA | USA | North America | 54.59 | 9.66M | 8.1M | 841.4K | 157.9K |
| 6 | Universal Studios Japan | Osaka | Japan | Asia-Pacific | 51.35 | 16.00M | 486.0K | 2.4M | 122.1K |
| 7 | Disneyland Park | CA | USA | North America | 50.04 | 17.25M | 594.0K | 719.4K | 115.8K |
| 8 | Tokyo DisneySea | Tokyo | Japan | Asia-Pacific | 48.62 | 12.40M | 516.0K | 5.5M | 89.7K |
| 9 | Universal Studios Florida | FL | USA | North America | 37.44 | 9.75M | 2.1M | 226.5K | 141.0K |
| 10 | Efteling | Kaatsheuvel | Netherlands | EMEA | 35.26 | 5.56M | 5.1M | 731.0K | 121.2K |
| 11 | Disney's Hollywood Studios | FL | USA | North America | 34.51 | 10.30M | 516.0K | 333.8K | 134.8K |
| 12 | Shanghai Disneyland | Shanghai | China | Asia-Pacific | 34.16 | 14.00M | 348.0K | 661.2K | 1.4K |
| 13 | Universal Islands of Adventure | FL | USA | North America | 32.76 | 10.00M | 594.0K | 874.4K | 96.9K |
| 14 | Disney California Adventure Park | CA | USA | North America | 31.24 | 10.00M | 408.0K | 1.2M | 69.6K |
| 15 | Disney's Animal Kingdom | FL | USA | North America | 29.61 | 8.77M | 118.8K | 300.0K | 129.2K |
| 16 | Chimelong Ocean Kingdom | Guangdong | China | Asia-Pacific | 28.35 | 12.52M | 22.8K | 7.8K | 0.2K |
| 17 | Puy du Fou | Les Epesses | France | EMEA | 28.20 | 2.50M | 6.5M | 222.0K | 87.8K |
| 18 | Europa Park | Rust | Germany | EMEA | 27.30 | 6.00M | 79.2K | 752.5K | 172.4K |
| 19 | Dollywood | TN | USA | North America | 24.89 | 4.3M | 4.4M | 367.3K | 51.0K |
| 20 | SeaWorld Orlando | FL | USA | North America | 23.53 | 4.34M | — | — | — |
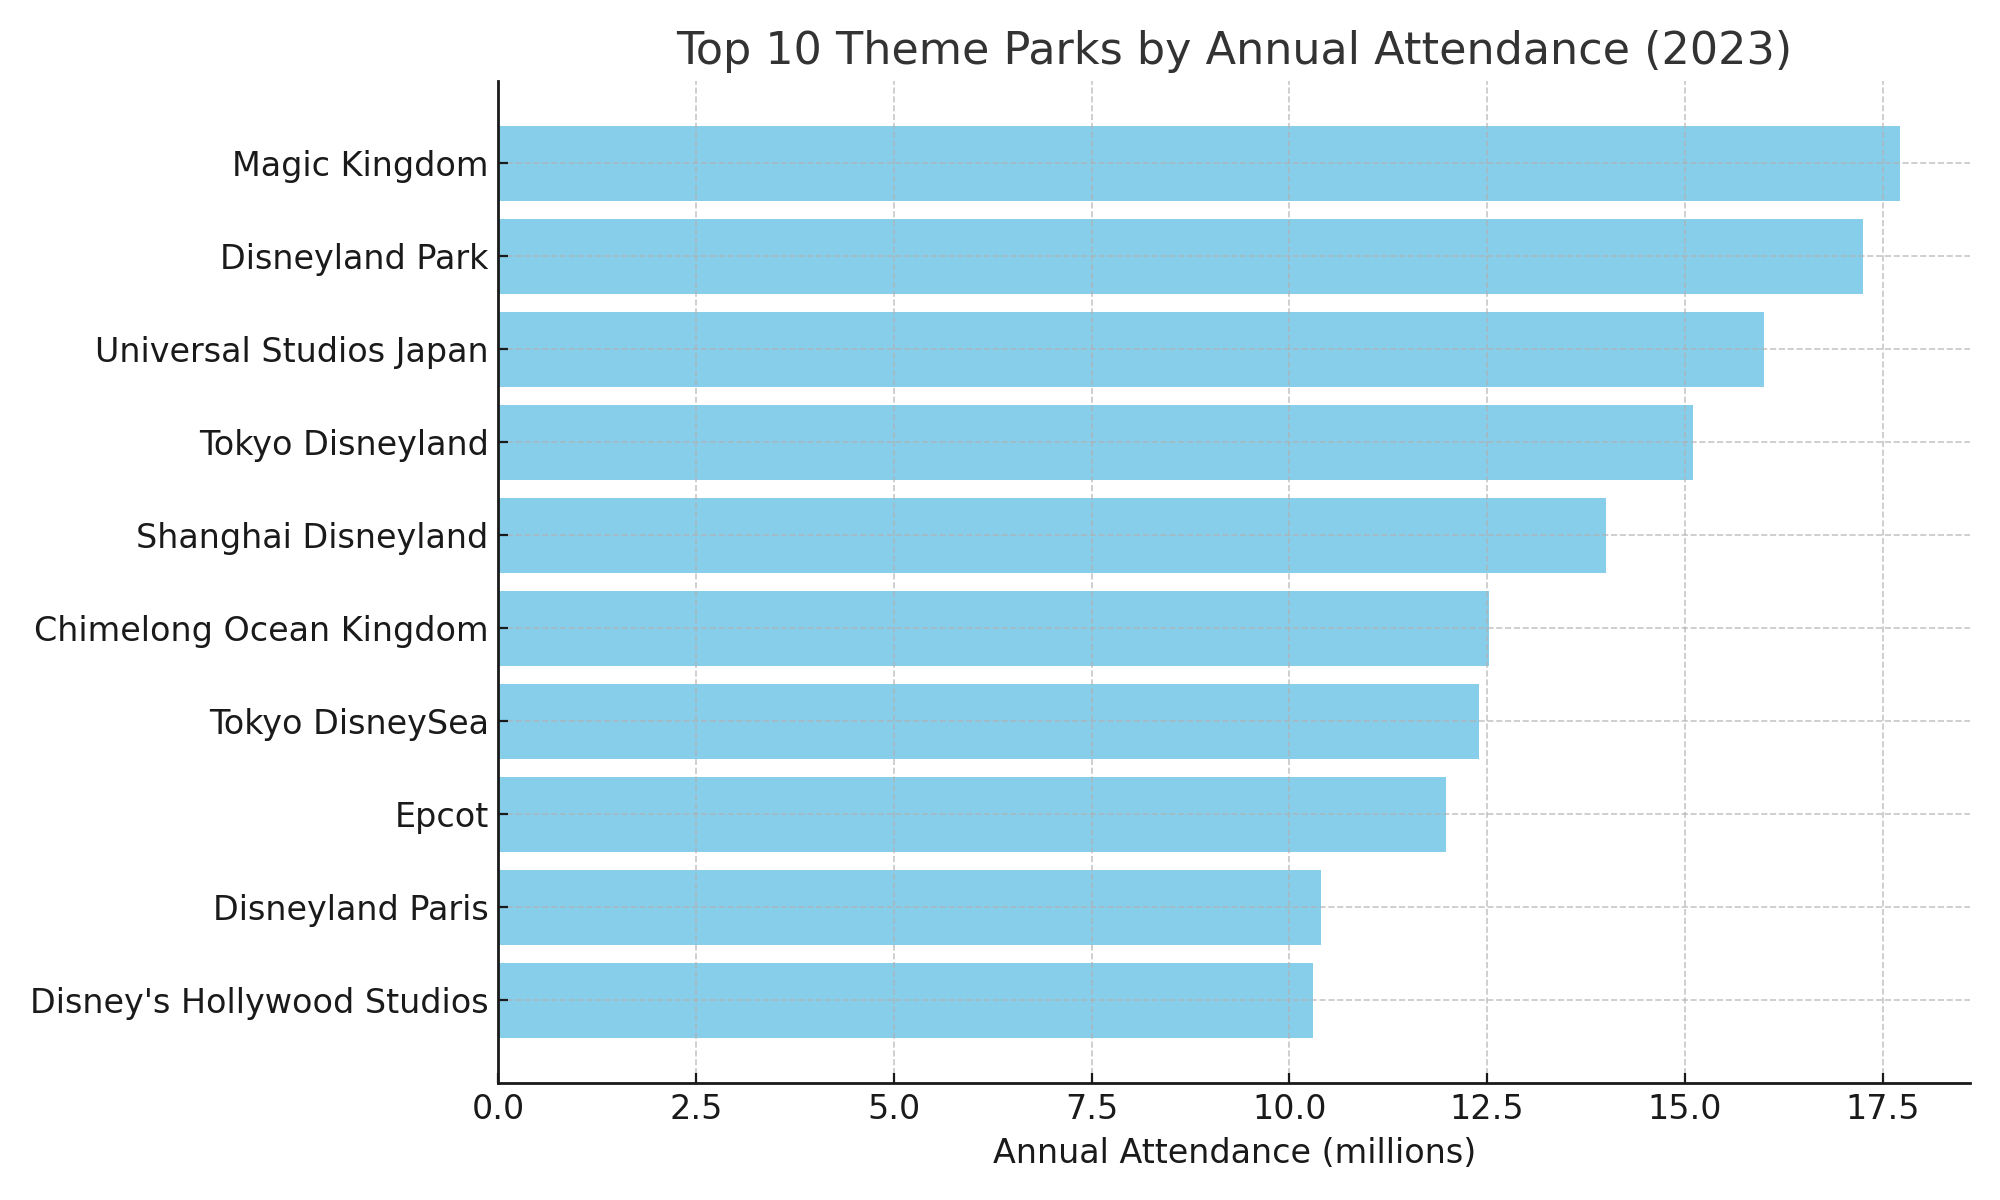
The bar chart reveals that Magic Kingdom and Disneyland Park dominate global theme park attendance, both exceeding 17 million visitors in 2023. These parks benefit from legacy status, prime locations, and massive brand power under the Disney umbrella. Interestingly, Tokyo Disneyland and Universal Studios Japan also rank highly, highlighting the rapidly growing interest in immersive theme park experiences in the Asia-Pacific region. This distribution underscores a key insight: while North American parks continue to lead, the global appetite for themed attractions is shifting eastward. The data suggests that continued investment in international markets—especially Japan and China—could yield major returns for theme park operators. Attendance figures provide a foundation for understanding not just popularity but also strategic growth potential worldwide.
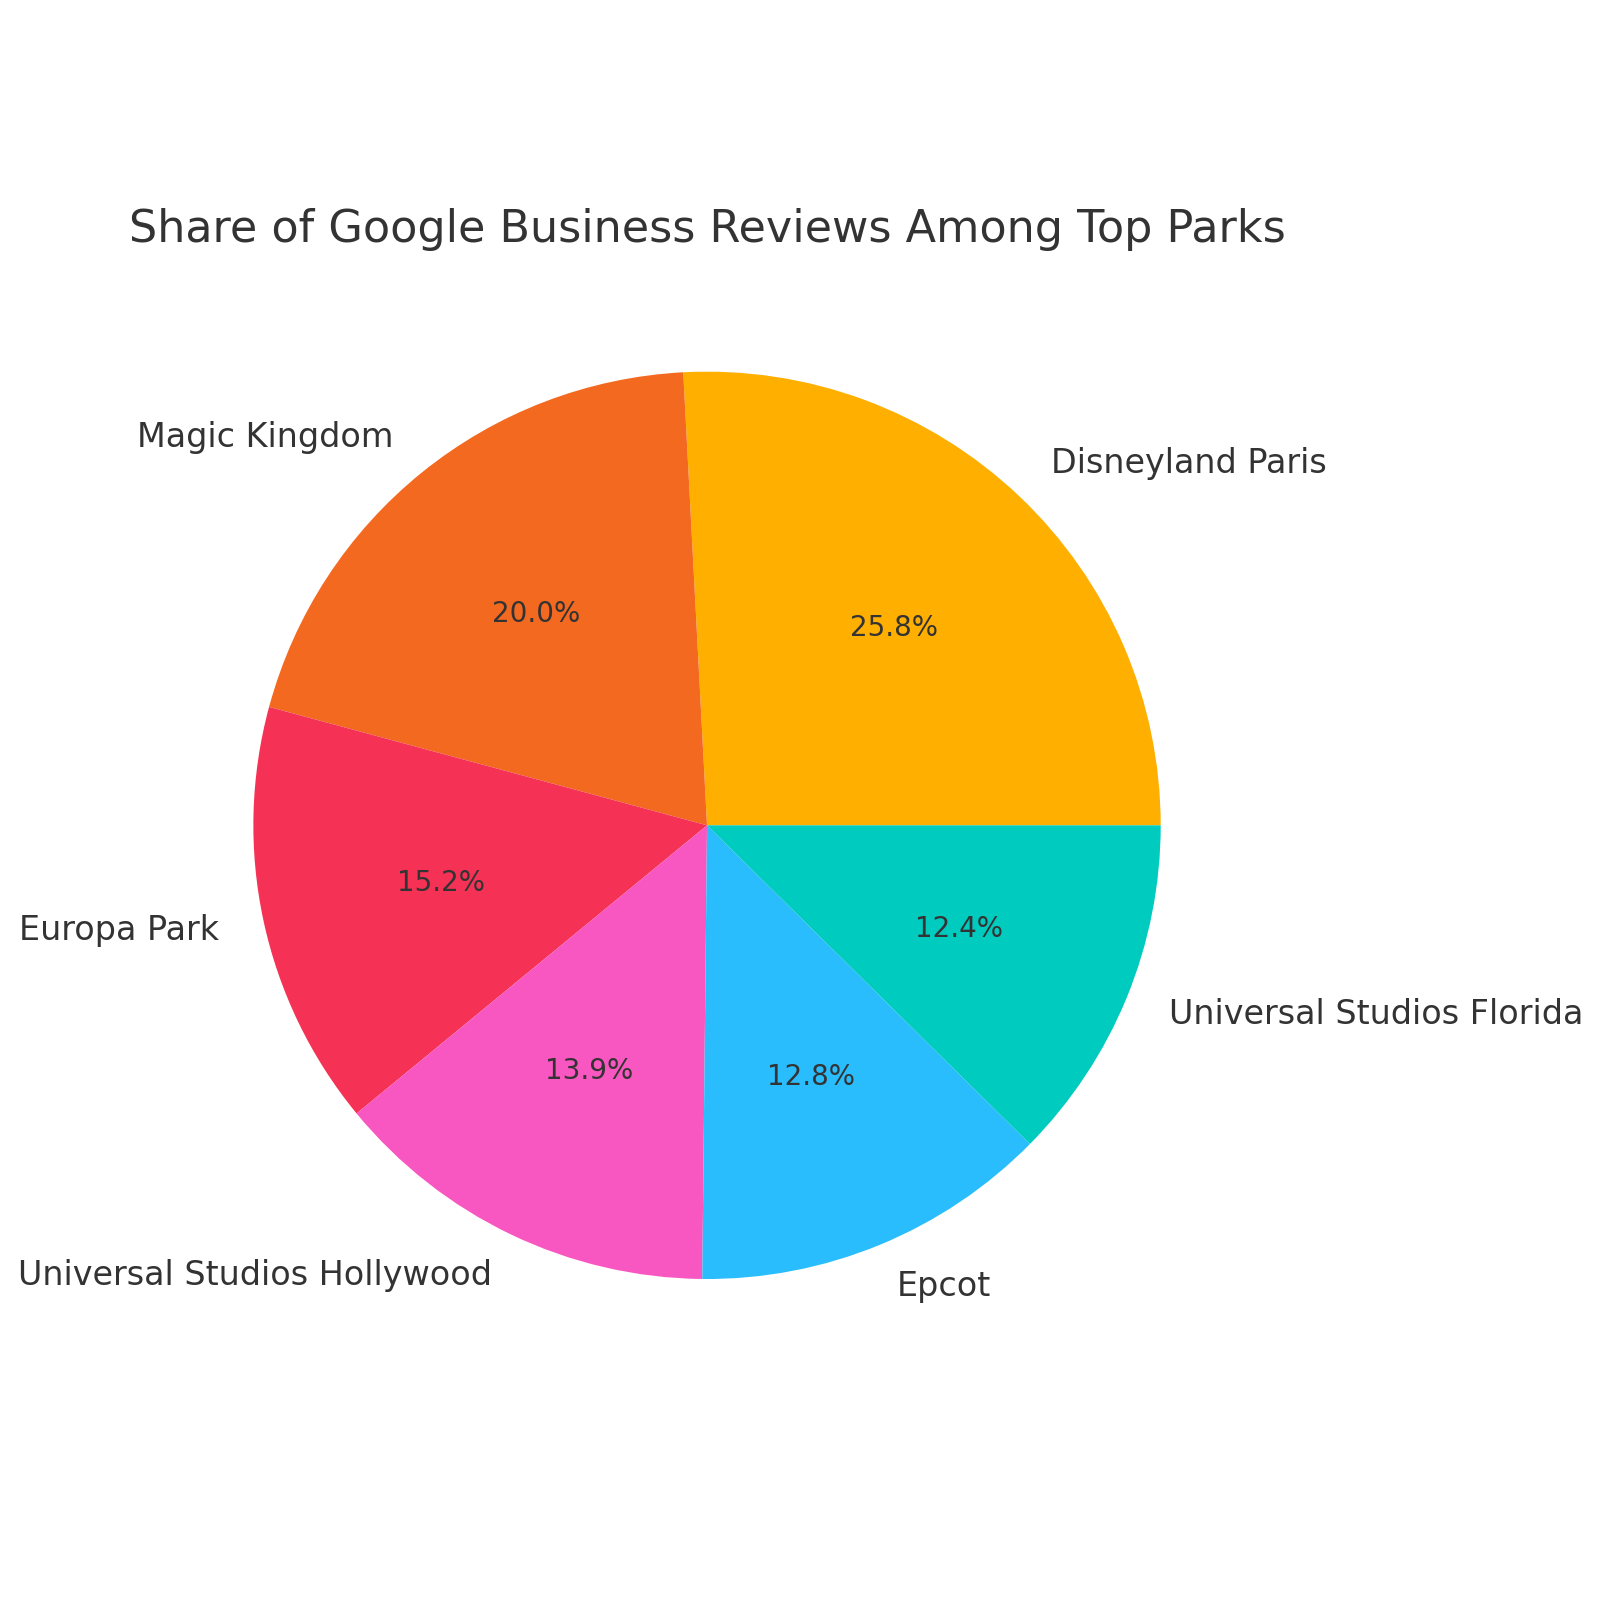
This pie chart illustrates the distribution of Google Business Reviews among the most frequently reviewed parks. Disneyland Paris surprisingly edges out others, with nearly 294,000 reviews, despite having lower attendance than some of its U.S. and Japanese counterparts. This implies that European guests are particularly likely to leave feedback, or that Disneyland Paris has a stronger localized presence on Google. Magic Kingdom, Universal Studios Hollywood, and Epcot follow closely, reinforcing the connection between high visitor numbers and digital engagement. However, the review volume also reflects deeper visitor behavior patterns: satisfaction, memorability, and digital culture norms in different regions. As such, this chart highlights how parks can leverage user-generated content and reputation management to complement physical visitor experiences—something increasingly vital in today’s search-driven tourism market.
The region-based bar chart shows that North America dominates the theme park landscape, accounting for more than half of the top 20 parks. This isn't surprising given the U.S.’s long-standing tradition of theme park innovation and Disney's stronghold in Florida and California. However, both EMEA (Europe, Middle East, and Africa) and Asia-Pacific regions are well-represented, with popular destinations like Disneyland Paris, Efteling, and Tokyo DisneySea standing out. This distribution suggests a globalizing industry where international markets are not just catching up but innovating in their own right. Parks in Asia-Pacific are increasingly competing on scale, experience design, and integration with local pop culture—laying the groundwork for a more balanced global market in the coming decade.